This is an excerpt from our most recent Economic Outlook report. To access the full PDF, please click here
A Deep Dive into the Post-COVID U.S. Individual Consumer
There is no doubt. This post-COVID era has been good for U.S. individual consumers.
Confirm this in the following chart. It shows you the U.S. Real Personal Consumption Expenditures per Capita and Real Disposable Personal Income per Capita timelines:
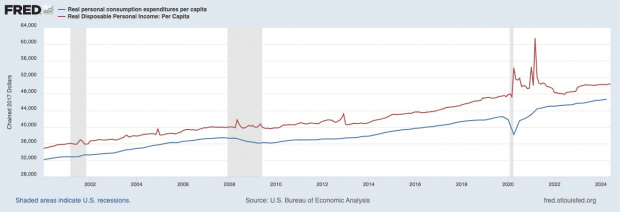
Image Source: U.S. Bureau of Economic Analysis
Yes. The 2 real U.S. consumer metrics are much higher than a prior ‘19 pre-COVID era.
Why? $4.6 Trillion!
According to Investopedia, that’s the total federal spending in response to COVID-19, including loans, stimulus checks, and vaccination and testing programs.
While you may have heard them referred to as stimulus checks, the Economic Impact Payments were direct deposited into bank accounts, or sent out as bank cards.
More than 476 million payments totaling $814 billion in financial relief went directly to U.S. households impacted by the pandemic:
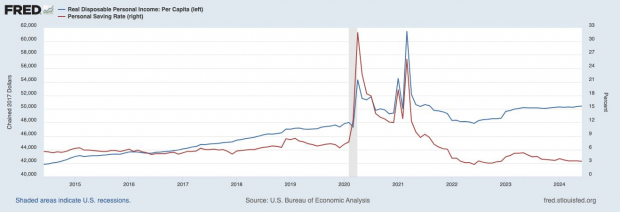
Image Source: U.S. Bureau of Economic Analysis
The IRS based the amounts individuals received on income, tax filing status, and number of children (or qualifying dependents, like a relative).
How much was paid in each of the three rounds?
• Round 1, March 2020: $1,200 per income tax filer, $500 per child (CARES Act).
Round 1 is consistent with the first notable March to June 2020 run-up in Real Personal Consumption in Durable Goods.
• Round 2, December 2020: $600 per income tax filer, $600 per child (Consolidated Appropriations Act, 2021)
• Round 3, March 2021: $1,400 per income tax filer, $1,400 per child (American Rescue Plan Act). Round 3 is consistent with the March 2021 spike seen in U.S. Real Personal Consumption in Durable Goods.
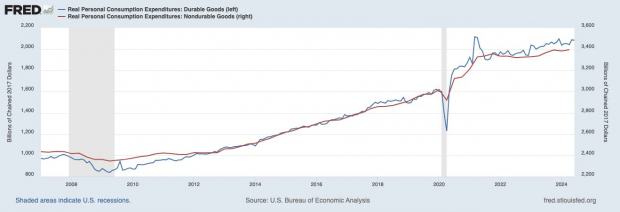
Image Source: U.S. Bureau of Economic Analysis
According to the U.S BLS—
The combined effects of increased demand for durables and shortages caused by supply-chain disruptions were the main source of inflation in Q2-2021.
Both the direct and indirect effects of those supply-chain problems remained substantial through the end of 2022.
Unsurprisingly, consumer prices for food were also affected by COVID-19, with Food-at-Home indexes generally rising and Food-Away-from-Home indexes becoming more volatile.
According to the National Bureau of Economic Research (NBER) in Sept. 2023—
Rising commodity prices and supply chain disruptions were the principal triggers of the recent burst of inflation.
But, as these factors have faded, tight labor markets and wage pressures are becoming the main drivers of the lower, but still elevated, rate of price increase.


This is an excerpt from our most recent Economic Outlook report. To access the full PDF, please click here


A Deep Dive into the Post-COVID U.S. Individual Consumer
There is no doubt. This post-COVID era has been good for U.S. individual consumers.
Confirm this in the following chart. It shows you the U.S. Real Personal Consumption Expenditures per Capita and Real Disposable Personal Income per Capita timelines:
Image Source: U.S. Bureau of Economic Analysis
Yes. The 2 real U.S. consumer metrics are much higher than a prior ‘19 pre-COVID era.
Why? $4.6 Trillion!
According to Investopedia, that’s the total federal spending in response to COVID-19, including loans, stimulus checks, and vaccination and testing programs.
While you may have heard them referred to as stimulus checks, the Economic Impact Payments were direct deposited into bank accounts, or sent out as bank cards.
More than 476 million payments totaling $814 billion in financial relief went directly to U.S. households impacted by the pandemic:
Image Source: U.S. Bureau of Economic Analysis
The IRS based the amounts individuals received on income, tax filing status, and number of children (or qualifying dependents, like a relative).
How much was paid in each of the three rounds?
• Round 1, March 2020: $1,200 per income tax filer, $500 per child (CARES Act).
Round 1 is consistent with the first notable March to June 2020 run-up in Real Personal Consumption in Durable Goods.
• Round 2, December 2020: $600 per income tax filer, $600 per child (Consolidated Appropriations Act, 2021)
• Round 3, March 2021: $1,400 per income tax filer, $1,400 per child (American Rescue Plan Act). Round 3 is consistent with the March 2021 spike seen in U.S. Real Personal Consumption in Durable Goods.
Image Source: U.S. Bureau of Economic Analysis
According to the U.S BLS—
The combined effects of increased demand for durables and shortages caused by supply-chain disruptions were the main source of inflation in Q2-2021.
Both the direct and indirect effects of those supply-chain problems remained substantial through the end of 2022.
Unsurprisingly, consumer prices for food were also affected by COVID-19, with Food-at-Home indexes generally rising and Food-Away-from-Home indexes becoming more volatile.
According to the National Bureau of Economic Research (NBER) in Sept. 2023—
Rising commodity prices and supply chain disruptions were the principal triggers of the recent burst of inflation.
But, as these factors have faded, tight labor markets and wage pressures are becoming the main drivers of the lower, but still elevated, rate of price increase.